

")

")

Our Latest Achievements and Developments
Water management is an ever-evolving field, and our team at RTC4Water is at the forefront of the latest developments.
We are proud to announce our recent successes, which showcase our dedication to finding innovative solutions to the challenges faced in this field.
Firstly, we are delighted to share that our joint application with the University of Luxembourg to the FNR for an Industrial Fellowship has been approved!
This achievement is a testament to the hard work and collaboration of our team, and we extend our gratitude to everyone who contributed to this success.
We would like to give a special thank you to Rodrigo Gesser, who took the lead in writing the proposal.
We are excited to continue our research in the areas of water and wastewater with this support.
In addition, we have made significant progress in optimizing sewage overflows during rain events with our product, LINKWATER.
While our VOLUME-based system is already highly effective, we identified a remaining problem with this methodology: it is possible to have a small sewer overflow with a high concentration into a small river on one side of the sewer system, while on the other side, a large volume with a low concentration is "successfully" prevented from overflowing. To address this, we have developed a prototype product that minimizes the LOAD going to the river during a rain event, which has shown promising results in initial simulations. Our PhD student, Rodrigo Gesser, played a key role in this development, and we extend our thanks to him.
Finally, we are excited to attend IFAT, where we will showcase our latest developments, including load-based control and our new water quality module.
We welcome you to visit us at the stands of our partners, Rittmeyer and DHI, and see these innovations in action.
At RTC4Water, we remain committed to pushing the boundaries of water management and developing solutions that benefit both our clients and the environment.
Stay tuned for more exciting updates from our team. #Water #wastewater #sewer
A Forgotten Tool for Reducing Pressure Fluctuations in Water Networks?
Under Pressure Part 2: How Autonomous Network Optimization Software Reduces Pressure Fluctuations.
It has taken some time, but the results have been well worth the wait. Early in 2017 one of our key partners, the Syndicat des Eaux du Sud (SES), ask our team to evaluate how a fully autonomous water network optimization software might be used to reduce the severity of pressure fluctuations in one section of their distribution network. At the time, there were no pressure monitoring tools in place at the target branch, so our analysis was based on modelling and other analytical techniques. Our preliminary analysis, which you can read about here, showed that networks that operate under pressure should see some benefit from using this type of software. But now we have performed a new study and the results, which were presented at CEOCOR 2019, really surpassed our expectations.
But What Is “Autonomous Network Optimization Software”?
While not new to the marketplace, many in the water or sewer industry may not be aware of a type of software designed to autonomously and predictively control flow and storage in a distribution network. Sometimes the term “real-time control” is used but this does not really describe this type of software’s capabilities as many modelling and industrial control solutions market themselves as a real-time solution only to still rely on input or monitoring by a human operator. In this article we will use the term “autonomous network optimization” to refer to any software that automatically and predictively monitors and adjusts flow and storage in a water distribution or sewer collection network – without human intervention. Typically, over-worked water engineers of small to medium sized networks use this software to optimize storage, reduce pumping costs, automatically mix water sources to control for pollution, etc. However, as one of the core functionalities of the software is to achieve a set point volume for each basin in the network by the end of the day – taking into account emergencies, maintenance, unusual demand across the network, etc. - one of the additional benefits is an overall reduction of pressure fluctuations. The autonomous network optimization software produced by RTC4Water is an example of this type of solution. If you would like to learn more about this type of system please visit this page.
What Kind of Network Was Studied?
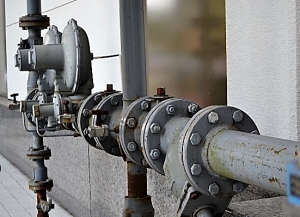
The SES water distribution system is relatively complex and consists of spring catchments, deep wells, pumping stations, disinfection plants, water storage tanks, pipelines and additional installations. Furthermore, there are several large industrial customers in the area. Parts of the SES network are characterized by large fluctuations in demand. The typical daily demand profile resulting from residential areas is further exacerbated by the large industrial users which are in many cases directly connected to the network (without a buffering basin). These fluctuations have in the past required the installation of substantial piping, which enabled the SES to deliver large amounts of water in a short time. However, the resulting transient high flow rates are undesirable because these can result in significant pressure fluctuations and pressure surges in the network.
The SES installed its autonomous network optimization software in early 2018. This study was performed on one of the branches of the network called the Clemency branch. As described above, the SES distribution system is generally characterized by highly fluctuating flows, with an associated expectation that the stresses the SES pipes are encountering may be relatively high. However, the Clemency branch is also characterized by low inflow heads in some basins, with supply issues under certain conditions. In the first study, pressure sensors were not available but have since been installed and the data made available for the study. As this was done prior to the installation of the software, a before and after (uncontrolled vs. controlled) comparison of the data can be made.
Before and After: The Difference Is Clear
The below chart shows one of the basins in the Clemency branch. It shows sampling of days reflecting hourly flow-data together with associated pressure data (hourly average, hourly minimum and hourly maximum pressure) prior to the software being installed. Once the software was installed pressure and debit data was recorded and agglomerated into an hourly reading. Prior to installing the software, it can be observed that the valve would open, typically five times per day, to let water in at a rate of around 60 m3/hour. In the pressure data this is reflected in a pressure drop of between 0.5 and 1 bar. The local pressure at each basin is, of course, also impacted by activities at the other basins in the branch.

The second chart shows the same basin but now with the software optimizing the flow rate into the basins based on specific performance goals. The software is not implicitly trying to keep the flow constant but is reacting to demand changes in an “intelligent” way – it takes a homogenous and predictive approach to the problem of managing the supply of water to all basins in the branch over the course of the day. Here it can be observed that the inflow is much more constant than in the first chart and this is also reflected in the pressure data. There are a fewer peaks and troughs which can be observed in the minimum and maximum pressure data which cannot be explained by valve changes in the Clemency basin and it is assumed that these pressure changes are caused by valve changes in another basin in the branch which, at the time of the study was not yet controlled by the software.

Assessing the Overall Benefit
We can easily see that the pressure rarely drops to lower than 4 bar in the controlled state, whereas in the uncontrolled state it was regularly dropping to around 3.5 bar. The other basis in the branch were analysed and similar results were found. In order to better demonstrate this effect, the authors decided to then develop a mathematical formula which would show the average pressure difference for three of the basins in the Clemency branch. As the software is designed to operate based on high-level performance objectives, it is normal that, during high levels of demand, the software will ensure that basins are kept full and place less importance on homogenous flow. As filling basins to their maximum has a significant effect on flow distribution – and therefore pressure – the authors introduced a “Top Level Reached” component into the analysis to better reflect overall conditions. The below chart shows average pressure differences (in meters) for Controlled, Uncontrolled and “Top Level Reached” (or Halten Oben for our German friends) for the three basins.

We can see that the controlled state offers a substantial improvement in pressure difference. The fact that generally the pressure difference in the uncontrolled and the “top level reached” states are similar is probably due to the fact that both generally involve a valve closure. Interestingly the “top level reached” state for the Bertrange basin results in a very high average pressure difference. This may be explained by closing a large valve too rapidly (this is a large basin).
Another Tool for Extending the Life of Your Valuable Infrastructure
As most professionals are aware, the topic of pressure corrections in water distribution networks usually turns to pressure reduction valves (PRVs) or transient modelling software. Pressure is a complicated topic and engaging an engineering company with specific experience in this domain is highly recommended. The purpose of this article is to introduce a relatively unknown tool which can be used, in additional to classical solutions, to help further reduce pipe bursts and extend infrastructure lifespan. If you would like to see the full study that was presented at CEOCOR 2019 please send an email to: Diese E-Mail-Adresse ist vor Spambots geschützt! Zur Anzeige muss JavaScript eingeschaltet sein!. We welcome any questions or comments that you may have about this study and look forward to hearing from you.
Under Pressure Part 1: can automated network optimization help reduce pressure fluctuations?
Recently one of our close partners, the Syndicat des Eaux du Sud (SES), asked our team to assess how an automated network optimization system might reduce pressure fluctuations. While this request was a little outside of the scope of our normal activities, we readily agreed to look deeper into this question. But there was a catch: we had no pressure monitoring tools to guide our work.
Pressure fluctuations: is this a problem?
Experts estimate that Europe has a water distribution network that exceeds 3.5 million kilometers. Naturally pipeline leaks are a serious concern for the industry and, by extension, so are the effects of pressure fluctuations on a network’s longevity. Research has determined that by deploying dynamic pressure management tools, organizations can expect a 10 to 15% savings on long-term capital expenditures[1]. But with budget and staff limitations, small or medium sized distribution networks may not have the ability to deploy and monitor wireless sensors or even install pressure reduction valves. For many organizations, finding additional support to implement cost efficient tools which extend the lifespan of existing infrastructure can be a difficult.
Where to Start?
As there were no pressure monitoring tools available, our team had to rely on the modelling tools and techniques that were already being developed for the client. SES was already concerned with finding new ways to create savings and so our team was already working with them to improve network efficiency without increasing operator workload. One section of their network was chosen and, once the mapping and modeling of the system was completed, a virtual environment was developed using EPANET and our Global Predictive Controller™ to dynamically test the network’s behavior with and without automated optimization. Specifically, an examination of the pressure fluctuations at the point of entry of the tanks was used to provide an indication of the expected reduction in pressure fluctuations. It is interesting to note that SES uses advanced flow control valves on some of their inlet valves and these valves are set-up to have reduced maximum flows – one way to reduce pressure fluctuations. And as most of the receiving reservoirs in this section did not have a large difference in elevation, we knew that this test might not show extraordinary results.
Preliminary results
The Global Predicative Controller is designed to “smooth out” or homogenize the activity of all basins, pumps and valves within the network based on organizations goals such as reserved capacity levels, water quality or pumping costs. In theory, this homogenization should reduce the long-term stress on the distribution infrastructure. With only modelling data to work with, it is difficult to assign a “real world” number which quantifies these cost savings. However, our analysis did show that there would be a significant reduction in pressure fluctuations for all reservoir inlets. Below is an example from one of the reservoirs:
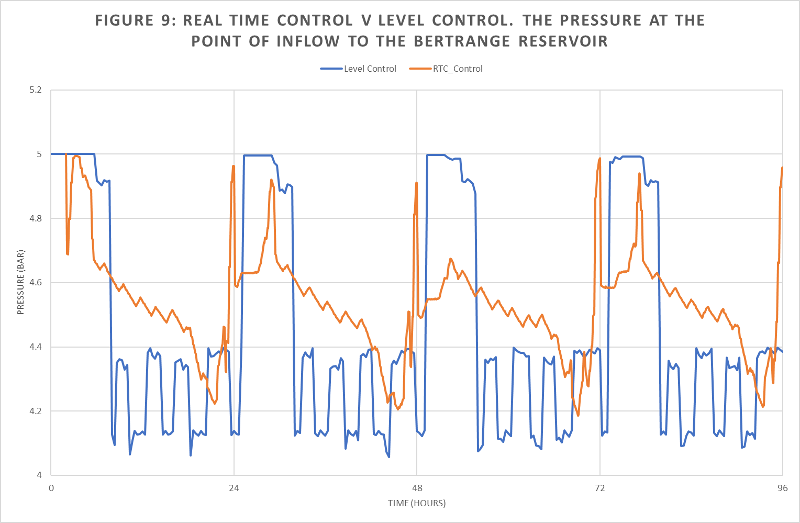
Since the difference in elevation between reservoirs for this test was not great, it cannot be said that the reduction in pressure fluctuations will have a large impact on the network’s lifespan. However, it is reasonable to accept that networks which operate under higher pressure conditions will see a significant benefit.
What can be said with some confidence is that the implementation of our system will improve the specific difficulty currently experienced here, which is that under certain conditions a reservoir may not receive a sufficient flow because other reservoirs are also filling up.
Exploring new technologies and looking for better ways to add value takes courage, and we are especially grateful to the SES team and Mr. Tom Levy for their support, not only as clients, but as experts dedicated to improving water quality. Mr. Levy was also instrumental to helping us present the technical results of this research at this year’s CEOCOR conference. Please see their website for the full abstract on this research and, as always, please contact us if you would like to know more about our products and services. We hope to repeat this analysis again using pressure data so please check out our Blog page from time to time if this topic is of interest to you.
[1] http://www.ee.co.za/article/advantages-water-pressure-management.html